Comparative suitability of spectral unmixing and object based image analysis for fractional cover mapping in savannas. 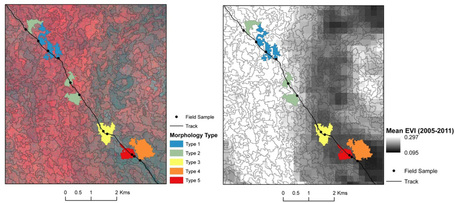
Sample object selection for mapping vegetation morphology types in the central Kalahari 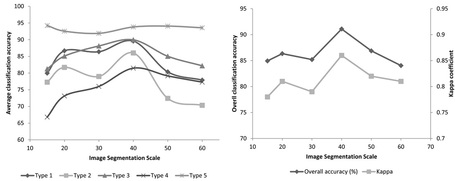
Vegetation morphology specific response of mapping accuracy to changing segmentation scale in object based image analysis 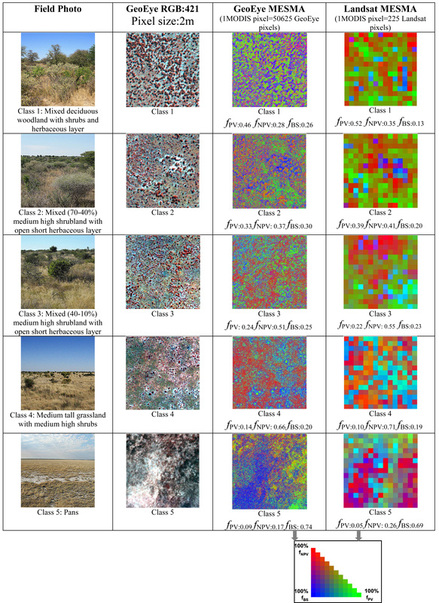
Upscaling fractional cover in savannas: Impact of Vegetation morphology and spatial resolution of satellite imagery.
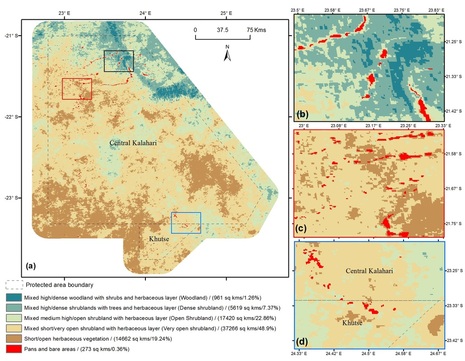
Vegetation morphology types in the central Kalahari and Khutse Game Reserve mapped using statistical and phenological matrices derived from satellite time-series. The central Kalahari region lacks basic environmental geodata and distinguishing and mapping savanna vegetation types presents significant methodological challenges from remote sensing perspective. This map is serving as a critical input for understanding fire frequency relationship with vegetation types as well as animal movement ecology to reduce human wildlife conflict.
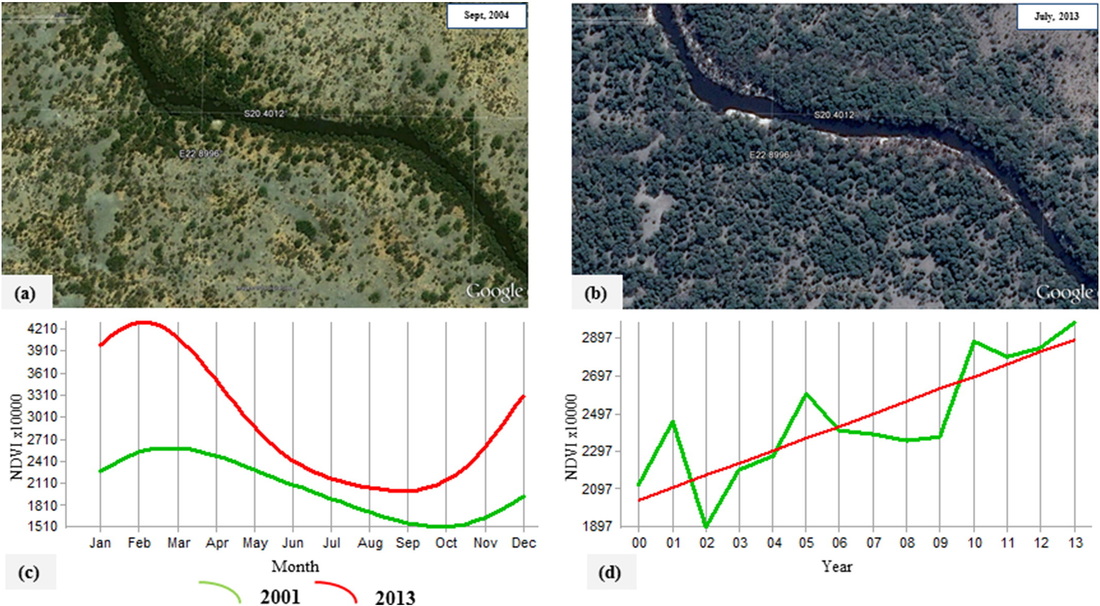
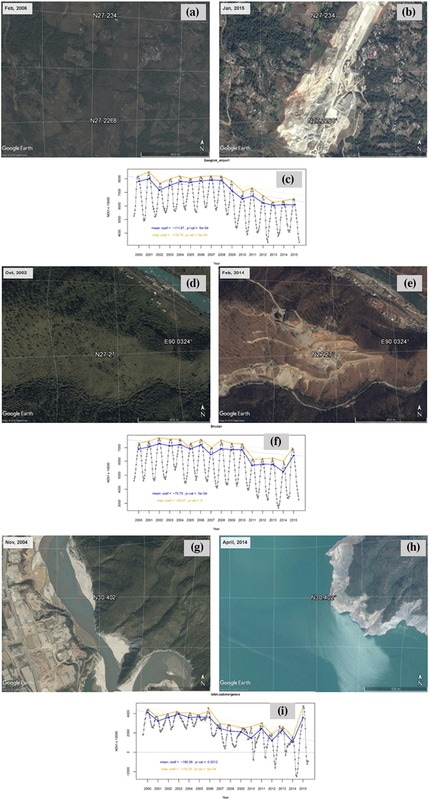
Fig (a) and (b) shows bush encroachment as a result of increased seasonal flooding of the Xudum for the location highlighted in Fig. 3.b. Xudum is a distributary of the Okavango river which connect the Lake Ngami and Okavango Delta. Fig.(c) represents seasonal curve of NDVI for first and last years of the time-series and Fig.(d) represents mean annual NDVI values for each year over the study period and fitted trend for a selected MODIS pixel.
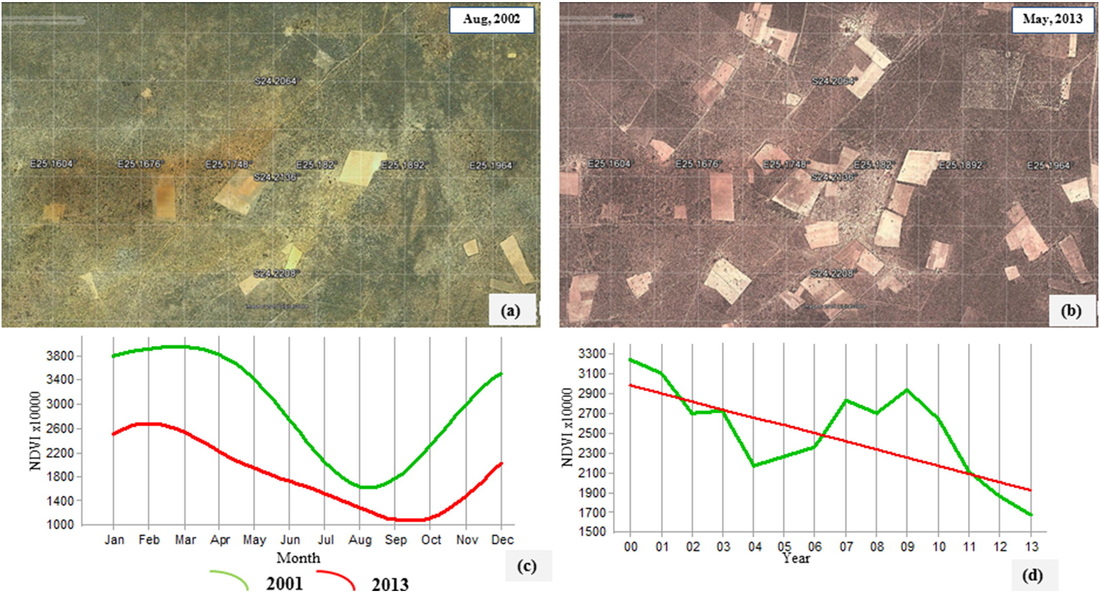
Fig.(a) and (b) shows changes in land cover as a result of direct human impact. Fig.(c) represents seasonal curve of NDVI for first and last years of the time-series and (d) represents mean annual NDVI values for each year over the study period and fitted trend for a MODIS pixel.
Inter-annual vegetation greenness trends derived from satellite time-series over the state of Uttarakhand, Indian Himalayas.
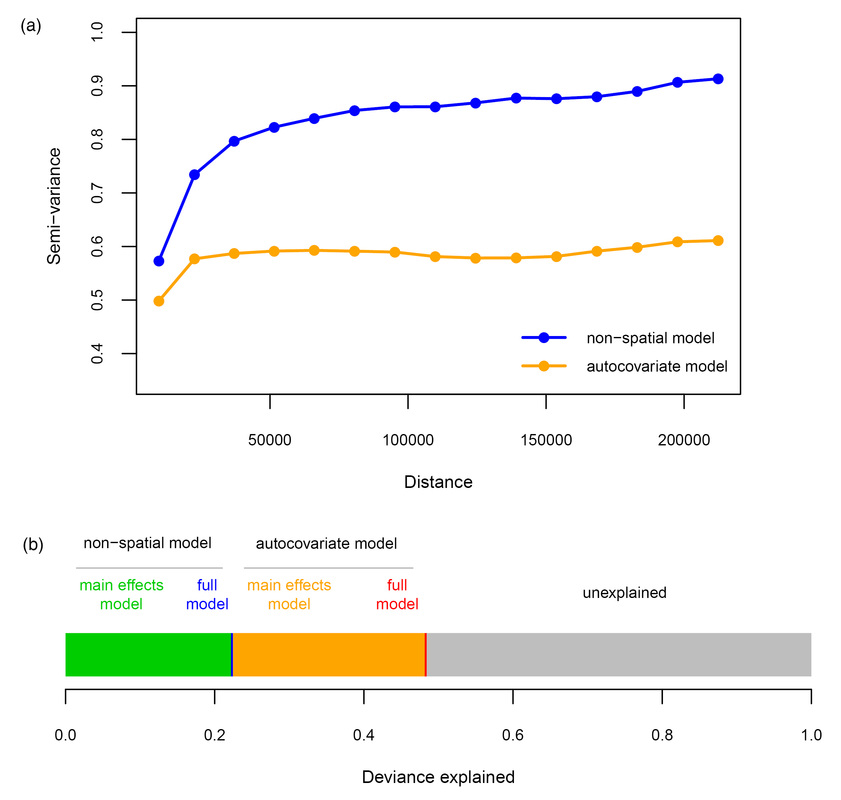
(a) Semi-variance as a function of distance and (b) Deviance explained (1 – residual deviance of a model/deviance of the null model) of various Poisson models. Non-spatial models do not account for spatial autocorrelation; autocovariate models incorporate an autocovariate as an explanatory
variable in the model. Full model included interaction between land use and vegetation type which were excluded in main effects models. All the four models were significantly different to each other at p<0.05. 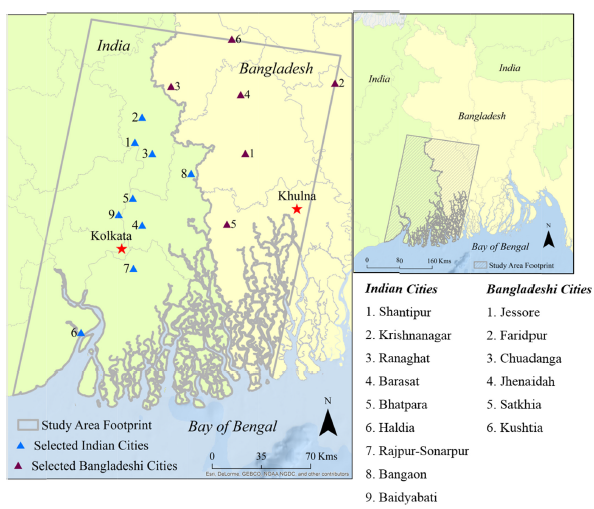
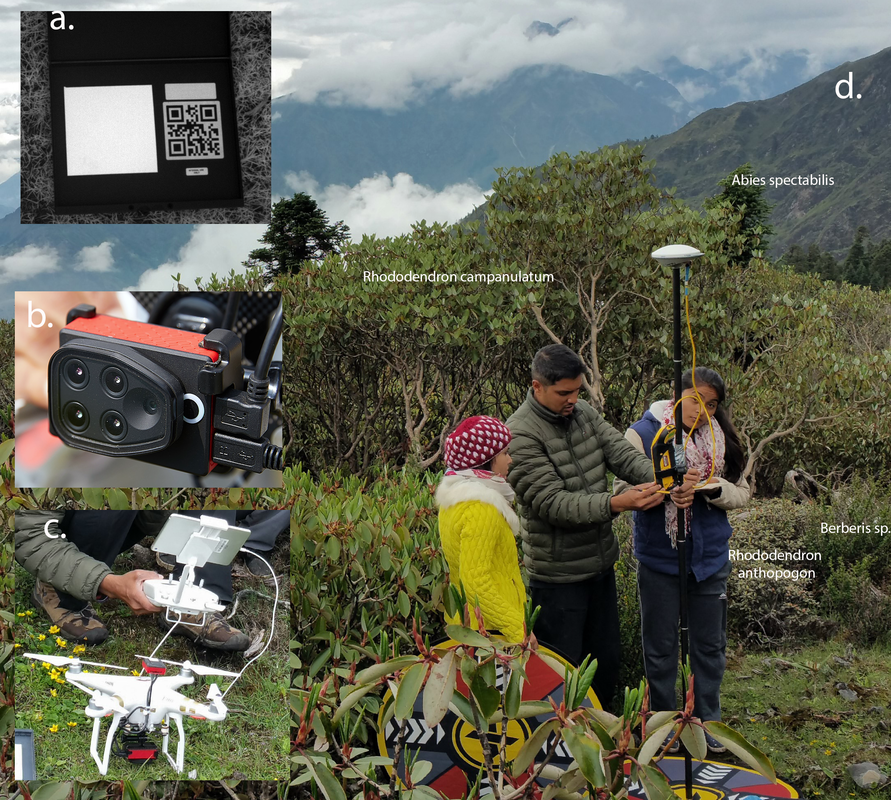
(a) Calibration panel used for estimating surface reflectance; (b) Sequoia camera that acquires images at fixed wavelengths including red-edge and near-infrared; (c) the entire UAS setup with remote and tablet used for mission planning; and (d) setting up ground control points (GCPs) prior to UAS mission in the treeline ecotone in Langtang national park (image date June, 2016). Also labeled are the woody species mapped in this study.
|
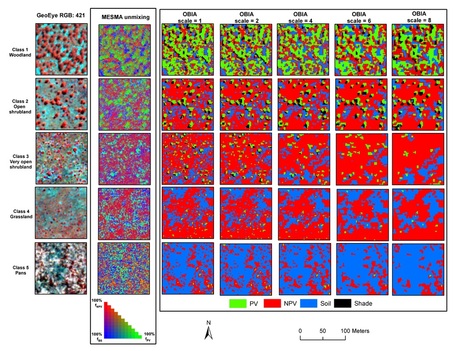
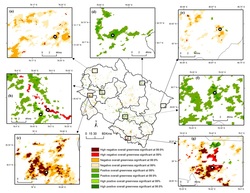
Doctoral Dissertation Research: In a time when ongoing climatic variability and increasing anthropogenic activity is resulting in fragmentation and loss of wildlife habitat and biodiversity, my dissertation research focused on understaning complex linkages between ecological pattern and processes leading to these changes in sourthern Africa savanna ecosystems. The overall goal of the research was to improve upon the existing limitations of satellite remote sensing in characterizing savanna pattern and processes. The results of my dissertation as well as ongoing work provide explicitly upscaled, linked, and validated multi-scale environmental data to wildlife ecologists and governmental environmental managers on Africa’s largest terrestrial protected area. The method of monitoring based on combining field data with satellite remote sensing examined is important especially for the developing countries in Africa that lack extensive ground resources for monitoring biodiversity and land cover conditions.The following three dissertation chapters were published as peer reviewed manuscripts: 1.Estimating fractional land cover in semi-arid central Kalahari: the impact of mapping method (spectral unmixing vs. object-based image analysis) and vegetation morphology) Focusing on the central Kalahari, this study utilized fractional cover of photosynthetic vegetation (fPV), non-photosynthetic vegetation (fNPV) and bare soil (fBS), derived in situ and estimated from GeoEye-1 imagery using Multiple Endmember Spectral Mixture Analysis (MESMA) and object-based image analysis (OBIA) to determine superior method for fractional cover estimation and the impact of vegetation morphology on the estimation accuracy. 2. Mapping vegetation morphology types in a dry savanna ecosystem: integrating hierarchical object-based image analysis with Random Forest To address the challenge of distinguishing and mapping vegetation morphology types in a low niche differentiation semi-arid environment, this study combined hierarchical object-based image analysis with machine learning techniques using the freeware statistical package R. Results show that individual vegetation morphology classes differed in the segmentation scale at which they achieved highest classification accuracy, reflecting their unique ecology and physiognomic composition. While classes with high vegetation density/height attained higher accuracy at fine segmentation scale, those with lower vegetation density/height reached higher classification accuracy at coarse segmentation scales. Contrarily, for pans and bare areas, accuracy was relatively unaffected by changing segmentation scale. Variable importance plots suggested that spectral features were the most important, followed by textural variables. 3.Relating spatial patterns of fractional land cover to savanna vegetation morphology using multi-scale remote sensing in the Central Kalahari This research examined the patterns of spatial association between fractional land cover and vegetation morphology types by utilizing information on soil properties and vegetation physiognomy in combination with GeoEye, SPOT, Landsat, and MODIS. Endmembers for Landsat TM and GeoEye-1 were derived from the image based on purity measures; for MODIS (MCD43A4), the challenge of finding spectral endmembers was addressed following an empirical multi-scale hierarchical approach. GeoEye-1-derived fractional estimates showed comparatively closest agreement with in situ measurements and were used to evaluate Landsat TM and MODIS. Overall results indicate that increasing pixel size caused consistent increases in variance of and error in fractional-cover estimates. Even at coarse spatial resolution, fPV was estimated with higher accuracy compared with fNPV and fBS. Assessment considering vegetation morphology of samples revealed both morphology- and cover-specific differences in accuracy. At larger pixel sizes, in areas with dominant woody vegetation, fPV was overestimated at the cost of mainly underestimating fBS; in contrast, in areas with dominant herbaceous vegetation, fNPV was overestimated with a corresponding underestimation of both fPV and fBS. These results underscore that structural and functional heterogeneity in semi-arid savanna both impact retrieval of fractional cover, suggesting that comprehensive remote sensing of savannas needs to take both structure and cover into account. Ongoing Research in the Central Kalahari, Botswana Over the last few decades Botswana government’s economic policy has aggressively pursued strategy of expanding privatized ranch-style livestock production that has led to the creation of large scale fenced leasehold livestock ranches in the central Kalahari leading to the fragmentation of previously wild areas. Habitat fragmentation has not only caused increased human-widlife conflict but also lead to altered fire regime and grazing pressure that is in turn affecting biogeochemical processes. Also, climatic predictions suggest that under current climatic developments, southern African savanna systems will experience an increased aridity due to higher mean temperatures and more highly variable mean annual precipitation, aggravating the resource base and sustainability of these ecosystems. Given these projections and my ongoing research in the southern African savanna focuses on: (i) Generating basic environmental geodata (e.g. land cover/vegetation morphology map) to support animal movement ecology researchers (ii) Characterizing short and long term trends in vegetation productivity using satellite time series data (iii) Examine how this spatio-temporal patterns and variability in vegetation dynamics relates to environmental (rainfall, temperature) and human drivers (anthropologically induced land use land cover change). MODIS derived vegetation greenness trends in African Savanna: Deconstructing and localizing the role of changing moisture availability, fire regime and anthropogenic impact n African savanna, spatio-temporal variability in moisture availability, fire regime and land transformation related to exploitative land uses are the main drivers of changing vegetation greenness patterns. Deconstructing the role of these drivers at local scale is critical for managing the impact of projected climate and land use changes on savanna ecosystems. Focusing on an area encompassing Africa's largest terrestrial protected area, this study utilized time-series MODIS NDVI (2000–2014) and employed a robust trend analysis technique to detect significant temporal trend in key greenness metrics including overall greenness, peak and timing of the peak of annual greenness and examined how spatial variability in vegetation morphology and land use impacted the distribution of these greenness parameters. To access causation of change, we linked detected greenness trends to precipitation trends derived from Tropical Rainfall Measurement Mission (TRMM), annual burnt area extent and fire frequency and compared multi-temporal imagery in Google Earth. Results show that distribution of both overall and peak annual greenness was vegetation morphology specific as with decreasing woody cover the proportion of pixels showing negative overall and peak annual greenness trend increased consistently. Majority of the area with significant trend in the timing of the peak of annual greenness showed late greenup, implying changing phenological patterns. Trend analysis of TRMM derived mean annual precipitation showed no significant change in precipitation over the study period. At local scale, increase in overall and peak annual greenness was associated with woody plant encroachment due to increased moisture availability and reduced fire frequency due to construction of fire breaks in areas under farm/ranch land use. In protected areas, negative overall and peak annual greenness was driven by unmanaged high intensity mega fire events and outside due to anthropogenic land clearing for pastoral agriculture. These results further our understanding of the complex interaction of multiple ecological factors and resultant spatial variability in savanna inter-annual vegetation greenness patterns and are useful for implementing local scale management strategies. Ongoing Research in the Uttarakhand Himalayas, India Himalayan mountain system in the Indian sub-continent are among the most ecologically sensitive environments and are also a repository of biodiversity and ecosystem services. Over the last few decades, land transformation related to exploitative land uses is among the main drivers of changing vegetation cover and productivity in western Himalayas. In a region where field based research is challenging due to heterogeneous relief and high altitude, quantifying changes in vegetation productivity using remote sensing can provide essential information regarding trends in vegetation cover and its linkages with Land Use Land Cover (LULC) dynamics. Ongoing research uses satellite derived time-series vegetation indices data in combination with in situ and ancillary information to examined spatio-temporal patterns in vegetation trend and its association with altitudinal gradient and LULC dynamics. For more details please refer to this recent publication: Spatio-temporal analysis of trends in seasonal vegetation productivity across Uttarakhand, Indian Himalayas, 2000–2014 Modeling spatio-temporal variability in fires in semi-arid savannas: A satellite based assessment around Africa's largest protected area The relative importance of various drivers of fire regimes in savanna ecosystems can be location specific. We utilized satellite derived time-series burned area (2001-2013) to examine how spatio-temporal variations in burned area and fire frequency were determined by rainfall, vegetation morphology and land use in semi-arid savanna. Mean precipitation of the rainy season (Nov-Apr) had a strong and positive relationship with burned area in the following dry season (variance explained 63%), with the relationship being strongest inside protected areas (variance explained 73%). Burned area and fire frequency were higher in vegetation types with higher herbaceous cover, indicating a causal link of herbaceous load to fire. Among land use, fire frequency was highest in protected areas and lowest in farms/ranches. Spatial models (generalized linear models with Poisson and negative binomial distribution) accounting for spatial autocorrelation showed that land use and vegetation types together explained about half of the deviance in null model (48%). Existence of fences/boreholes resulted in finer scale spatial differences in fire frequency. There was minimal dependence of vegetation types to land use classes in determining fire frequency (interaction between the two predictors was minimal). These results have significant implications for understanding drivers of fire activity in savanna ecosystems. Land use and land cover (LULC) change in the Ganges-Brahmaputra delta (GBD) poses significant challenges towards future environmental sustainability of the region and requires regional scale monitoring of key bio-physical variables and changes in their inter-relationship over space and time. Focusing on the southern part of the lower GBD region along the international border of India
and Bangladesh, this study examined the spatio-temporal variability of LULC change and its relationship with Land Surface Tem- perature (LST). Furthermore, LULC-LST relationships were compared between Indian and Bangladesh part and its trend in and around big cities (with more than 1 million population) and towns (with more than 100,000 population) was investigated. Results showed that LST changes were predominantly driven by LULC changes on both sides of the border. Urban growth is the dominant form of LULC change, and the rate of land change was faster in 2005-2010 time period than 1989-2005. Over the period of 21 years, mean January LST decreased by approximately 1.83 o C in Indian part and 1.85 o C in the Bangladesh part. Areas that changed from to rural from agricultural experienced decrease in mean LST, whereas those areas that changed to urban from either agriculture or rural, experienced increase in mean LST. The relationship between LULC and LST are same on both sides of the Indo-Bangladesh border. In bigger cities like Kolkata (in India) and Khulna (in Bangladesh), there is a high spatial variability in relationship between LULC and LST compared to large towns. The LULC-LST relationship in large towns in India was influenced by proximity to Kolkata and coastal areas, whereas in Bangladesh no such influence was evident. The results and the data produced in this study are crucial for monitoring LULC changes, for developing spatial decision support system, and thus will be helpful to address the current challenges of land management in the GBD region. Changes in the LULC and LST are important indicators of GBD's environmental health and access its vulnerability and thus the present findings serve as baseline in- formation for future studies seeking to examine the impact of differential policies on the LULC change in the region. Greening and browning of the Himalaya: Spatial patterns and the role of climate change and human drivers
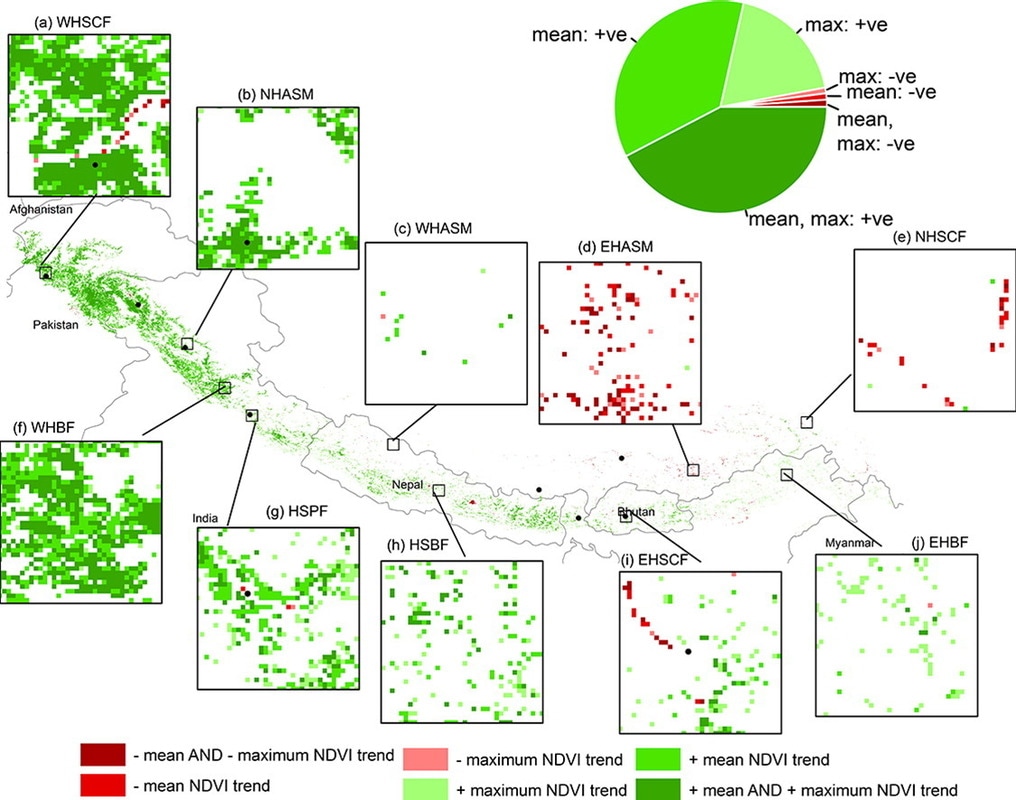
The reliable detection and attribution of changes in vegetation greenness is a prerequisite for the development of strategies for the sustainable management of ecosystems. We conducted a robust trend analysis on remote sensing derived vegetation index time-series matrices to detect significant changes in inter-annual vegetation productivity (greening versus browning) for the entire Himalaya, a biodiverse and ecologically sensitive yet understudied region. The spatial variability in trend was assessed considering elevation, 12 dominant land cover/use types and 10 ecoregions. To assess trend causation, at local scale, we compared multi-temporal imagery, and at regional scale, referenced ecological theories of mountain vegetation dynamics and ancillary literature. Overall, 17.56% of Himalayan vegetation (71,162 km2) exhibited significant trend (p < 0.01) and majority (94%) showed positive trend (greening). Trend distribution showed strong elevational and ecoregion dependence as greening was most dominant at lower and middle elevations whereas majority of the browning occurred at higher elevation (> 3800 m), with eastern high Himalaya browning more dominantly than western high Himalaya. Land cover/use based categorization confirmed dominant greening of rainfed and irrigated agricultural areas, though cropped areas in western Himalaya contained higher proportion of greening areas. While rising atmospheric CO2concentration and nitrogen deposition are the most likely climatic causes of detected greening, success of sustainable forestry practices (community forestry in Nepal) along with increasing agricultural fertilization and irrigation facilities could be possible human drivers. Comparison of multi-temporal imagery enabled direct attribution of some browning areas to anthropogenic land change (dam, airport and tunnel construction). Our satellite detected browning of high altitude vegetation in eastern Himalaya confirm the findings of recent dendrochronology based studies which possibly resulted from reduced pre-monsoon moisture availability in recent decades. These results have significant implications for environmental management in the context of climate change and ecosystem dynamics in the Himalaya. Species-Level Vegetation Mapping in a Himalayan Treeline Ecotone Using Unmanned Aerial System (UAS) Imagery
Understanding ecological patterns and response to climate change requires unbiased data on species distribution. This can be challenging, especially in biodiverse but extreme environments like the Himalaya. This study presents the results of the first ever application of Unmanned Aerial Systems (UAS) imagery for species-level mapping of vegetation in the Himalaya following a hierarchical Geographic Object Based Image Analysis (GEOBIA) method. The first level of classification separated green vegetated objects from the rest with overall accuracy of 95%. At the second level, seven cover types were identified (including four woody vegetation species). For this, the suitability of various spectral, shape and textural features were tested for classifying them using an ensemble decision tree algorithm. Spectral features alone yielded ~70% accuracy (kappa 0.66) whereas adding textural and shape features marginally improved the accuracy (73%) but at the cost of a substantial increase in processing time. Contrast in plant morphological traits was the key to distinguishing nearby stands as different species. Hence, broad-leaved versus fine needle leaved vegetation were mapped more accurately than structurally similar classes such as Rhododendron anthopogon versus non-photosynthetic vegetation. Results highlight the potential and limitations of the suggested UAS-GEOBIA approach for detailed mapping of plant communities and suggests future research directions.
|
